

Image Details
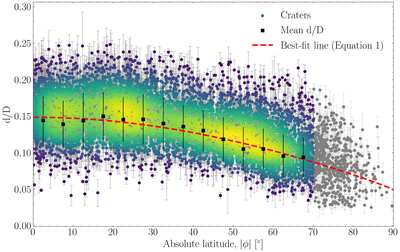
Caption: Figure 4.
Simple crater d/D versus absolute latitude on Ceres. Points are colored by density and error bars denote 1 standard deviation from the mean d/D measured across multiple 1D profiles (Section 3). Square points denote the uncertainty-weighted mean and standard deviation binned in increments of 5° latitude. The dashed line is a least-squares fit of the form given by Equation (1) to all craters between ±70°, including their uncertainties.
Other Images in This Article
Copyright and Terms & Conditions
© 2026. The Author(s). Published by the American Astronomical Society.

Copyright ©
2026 Astronomy Image Explorer. All Rights Reserved.
