

Image Details
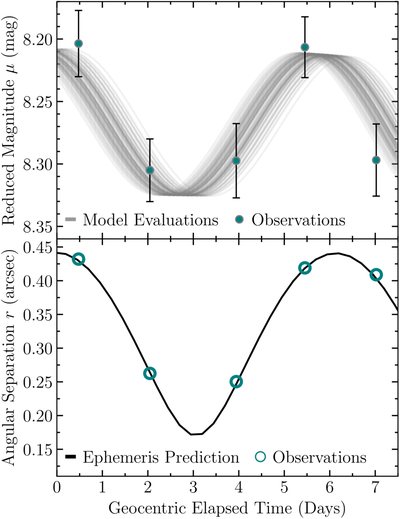
Caption: Figure 2.
Top: F606W band photometry. These data were taken consecutively with a spacing of ≈1.5 days. The x-axis is in geocentric elapsed time, where t = 0 coincides with an epoch of maximum elongation of Weywot from Quaoar. The 100 model evaluations correspond to the lightcurve solution presented below (Equation (8)), allowing ϕ to vary within its uncertainty. Bottom: angular separation of Weywot from Quaoar versus time. The black line is the prediction based on the published ephemeris. The fact that the photometry and angular separation come to maximum and minimum at similar times supports Weywot’s spin being synchronized to the orbit, and also indicates a triaxial shape for Weywot.
Other Images in This Article
Copyright and Terms & Conditions
© 2026. The Author(s). Published by the American Astronomical Society.

