

Image Details
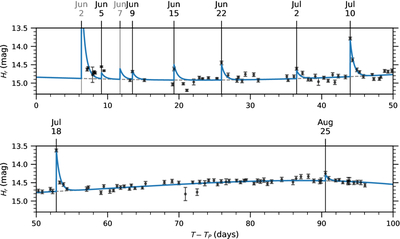
Caption: Figure 3.
Absolute r-band magnitude of comet 7P vs. time from perihelion. A polynomial fit to the quiescent activity is shown (dashed line). Outbursts are marked with vertical lines, including the June 2 (G. van Buitenen 2021) and June 7 (K. Sharma et al. 2021b) outbursts, which are labeled in gray. Illustrative models for each outburst’s evolution are shown as exponential functions (solid line).
Other Images in This Article
Copyright and Terms & Conditions
© 2026. The Author(s). Published by the American Astronomical Society.

Copyright ©
2026 Astronomy Image Explorer. All Rights Reserved.
