Image Details
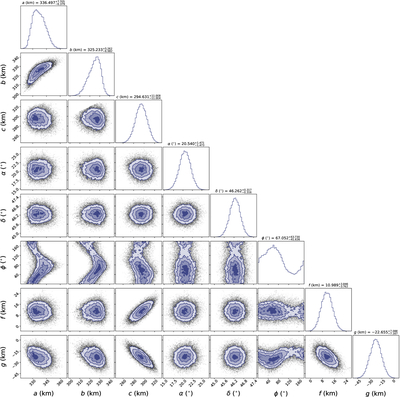
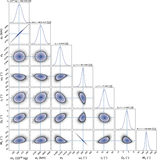
Caption: Figure 1.
A corner plot showing the triaxial shape model derived for G!kún∣∣’hòmdímà. Marginal (one-dimensional) parameter posterior distributions are shown along the tops of each column, while joint (two-dimensional) parameter distributions for each pair of parameters are shown as contour plots. Contours show the 0.5σ, 1σ, 1.5σ, and 2σ confidence intervals. Black points show individual samples from the MCMC chain.
Other Images in This Article
Copyright and Terms & Conditions
© 2026. The Author(s). Published by the American Astronomical Society.
Copyright ©
2026 Astronomy Image Explorer. All Rights Reserved.