Image Details
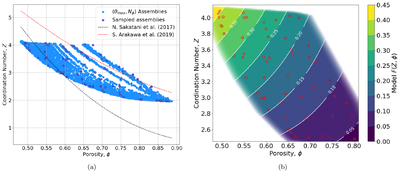
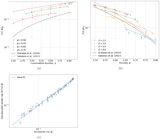
Caption: Figure 4.
(a) The (Z, ϕ)-parameter space, indicating the assemblies produced by RBDR with blue circles. The assemblies sampled for thermal simulations are highlighted here with a purple circle. The parameter spaces sampled by N. Sakatani et al. (2017) (dashed black) and S. Arakawa et al. (2019) (dashed red) are shown for reference. (b) Contours of dimensionless conductivity F(Z, ϕ) with respect to coordination number Z and porosity ϕ. The white lines are the constant conductivity isolines, and the color bar indicates the weighted least-squares best fit to simulation data. The red circles represent the particle assemblies in thermal equilibrium used for fitting.
Other Images in This Article
Copyright and Terms & Conditions
© 2026. The Author(s). Published by the American Astronomical Society.