Image Details
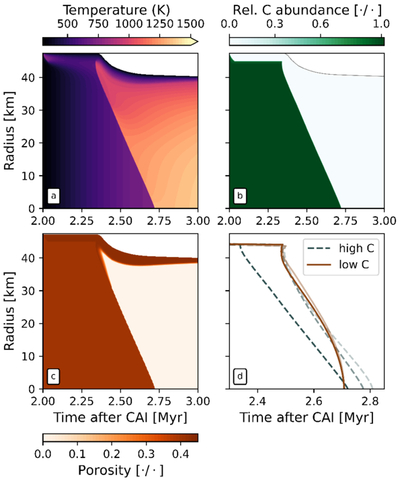
Caption: Figure 13.
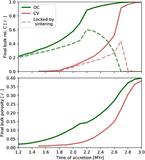
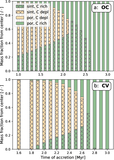
Sample evolution of a Rc = 40 km CI body, with 3.5 wt% initial C abundance and comparison with low spatial resolution runs, as well as fiducial low C abundance ones. (a) Temperature evolution of the first Myr since the planetesimal’s accretion. (b) Evolution of its C reservoir normalized to the initial abundance. (c) Evolution of its porosity. (d) Comparing runs with high vs. low C abundances and different spatial resolutions. Each line is a run’s C depletion front, the location and time where valve venting is first active. The dark-green, dashed lines have 3.5 wt% C, while the brown solid lines have fiducial 0.27 wt% C. The three high C runs, from left to right, have spatial resolutions of 200, 400, and 800 m, respectively. From left to right, the low C runs have 200 and 800 m resolutions, respectively.
Other Images in This Article
Show More
Copyright and Terms & Conditions
© 2026. The Author(s). Published by the American Astronomical Society.