Image Details
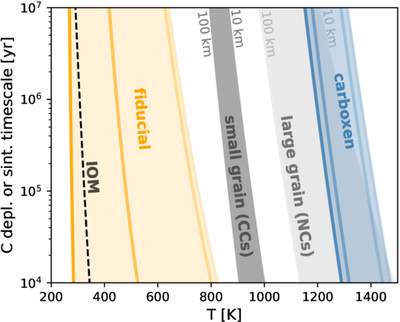
Caption: Figure 10.
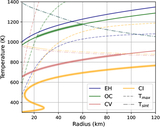
Comparing timescales of reaction kinetics with those of sintering across temperatures. Orange and blue bands: timescales of depletion using the rates that assume open-system flow with Pconf = 0, and an initial C content of 0.3 vol%. The orange band utilizes our fiducial reaction rates, while the blue band employs oxidation rates of carboxen from I. C. Jaramillo et al. (2014), a standard carbon black analogous to chondritic amorphous C and soot. The four lines in each band are, from left to right, timescales for CI, CV, OC, and EH redox states. The dashed black line is the depletion timescale using the destruction of aliphatic C–H in chondritic IOM from Y. Kebukawa et al. (2010). The two gray bands are sintering timescales at the center of a Rc = 10–100 km body with 40% porosity. The lighter-gray band uses a grain size d = 1 mm, while the darker band uses d = 1 μm.
Other Images in This Article
Show More
Copyright and Terms & Conditions
© 2026. The Author(s). Published by the American Astronomical Society.