Image Details
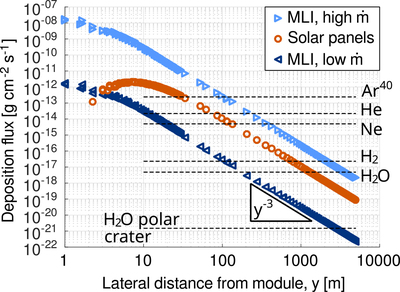
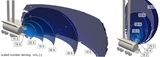
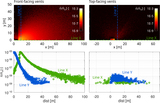
Caption: Figure 12.
Deposited fluxes from the solar panels and the MLI up to 5 km from the surface module. Log scale. The triangle indicates the expected theoretical slope ∝y−3. The expected natural abundance of lunar exospheric species (Table 2) is indicated with dashed lines.
Other Images in This Article
Show More
Copyright and Terms & Conditions
© 2026. The Author(s). Published by the American Astronomical Society.
Copyright ©
2026 Astronomy Image Explorer. All Rights Reserved.