Image Details
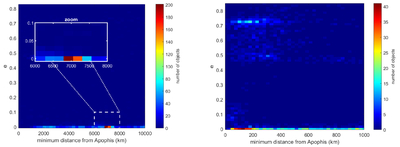
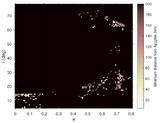
Caption: Figure 3.
Eccentricity of objects as a function of the minimum possible distance from Apophis, in the case of the current 2025 population with mean anomaly sampling (left) and in the case of the complete simulated population (right). In the left panel, the inset plot shows a zoom of the most populated area. Note the different ranges in the x-axis between the left and right panels.
Other Images in This Article
Copyright and Terms & Conditions
© 2026. The Author(s). Published by the American Astronomical Society.
Copyright ©
2026 Astronomy Image Explorer. All Rights Reserved.