Image Details
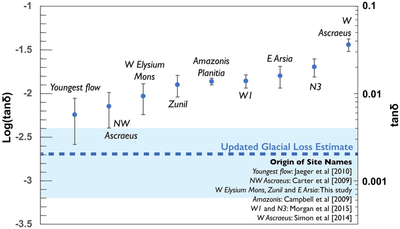
Caption: Figure 5.
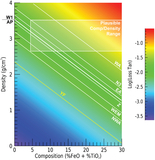
Loss tangent values from the split-chirp attenuation method for the nine volcanic study sites (see Table 1). The dashed blue line represents the mean loss tangent estimation from the five glacial sites. Error bars and the blue bar represent ±1σ.
Other Images in This Article
Copyright and Terms & Conditions
© 2026. The Author(s). Published by the American Astronomical Society.
Copyright ©
2026 Astronomy Image Explorer. All Rights Reserved.