Image Details
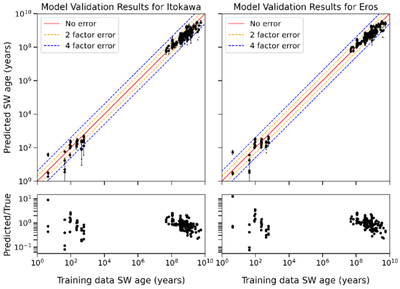
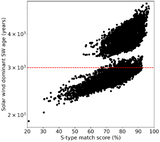
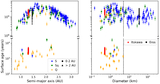
Caption: Figure 2.
Top: scatter plot of the training and predicted values after k-fold cross validation for both Itokawa and Eros. The red line represents an exact match, the orange line a 2-factor error, and the blue line a 4-factor error. Bottom: the ratio between the predicted SW age and the training data SW age.
Other Images in This Article
Copyright and Terms & Conditions
© 2026. The Author(s). Published by the American Astronomical Society.
Copyright ©
2026 Astronomy Image Explorer. All Rights Reserved.