Image Details
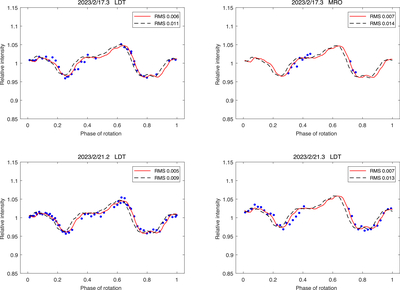
Caption: Figure 4.
Example light curves at which the difference between the constant-period model (dashed black curve) and the model with the two different periods (solid red curve) is most prominent. The blue points are measured photometric data normalized to the unit mean brightness.
Other Images in This Article
Copyright and Terms & Conditions
© 2025. The Author(s). Published by the American Astronomical Society.
Copyright ©
2026 Astronomy Image Explorer. All Rights Reserved.