Image Details
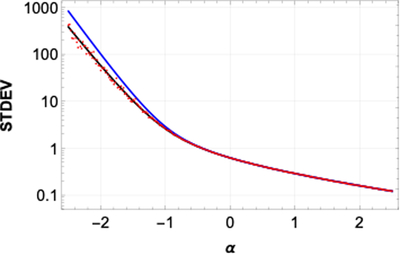
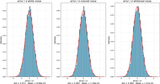
Caption: Figure 13.
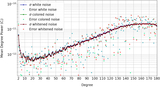
Expected STDEV of simulated ﹩{y}_{1}﹩ data calculated by using the discrete formula (Equation (A.26); black line) and the continuous formula (Equation (A.8); blue line, with cutoffs) as functions of ﹩\alpha ﹩. We assumed ﹩{h}_{y}=1﹩, ﹩N={10}^{5}﹩, ﹩{\rm{\Delta }}t=1﹩ s, and ﹩\tau ={\rm{\Delta }}t﹩. Red points represent the STDEVs of the simulated Doppler data ﹩{y}_{1}﹩ for several values of ﹩\alpha ﹩.
Other Images in This Article
Show More
Copyright and Terms & Conditions
© 2026. The Author(s). Published by the American Astronomical Society.
Copyright ©
2026 Astronomy Image Explorer. All Rights Reserved.