Image Details
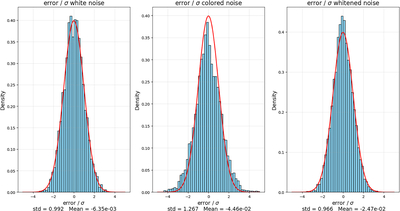
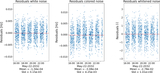
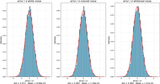
Caption: Figure 12.
Histogram of the ratio between estimated errors and formal uncertainties for the white noise, colored noise, and whitened noise cases, assuming only X-band tracking for the plasma noise. For reference, a red curve shows the standard Gaussian distribution. The mean and standard deviation of each case are also reported. Only coefficients up to degree 70 are included, since the lower degrees are the most affected by noise, while at higher degrees the solution is dominated by the Kaula constraint.
Other Images in This Article
Show More
Copyright and Terms & Conditions
© 2026. The Author(s). Published by the American Astronomical Society.
Copyright ©
2026 Astronomy Image Explorer. All Rights Reserved.