Image Details
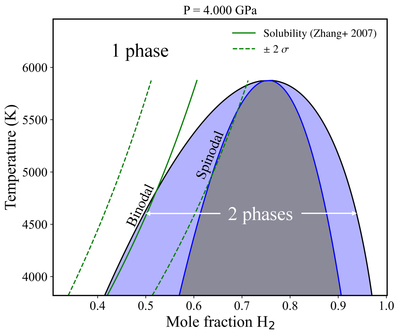
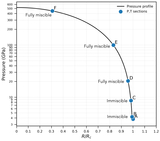
Caption: Figure 6.
Isobaric phase diagram for the Fe–H2 binary system based on Equation (4). The extrapolation of the low-P and low-T hydrogen solubility in liquid Fe metal is shown for comparison (H.-W. Zhang 2007; G. Jiang et al. 2011). Errors for the latter are derived by standard propagation of uncertainties.
Other Images in This Article
Show More
Copyright and Terms & Conditions
© 2025. The Author(s). Published by the American Astronomical Society.
Copyright ©
2026 Astronomy Image Explorer. All Rights Reserved.