Image Details

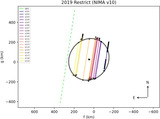
Caption: Figure 10.
A corner plot of the MCMC chains from the satellite orbit fit. The two-dimensional contour plots show the joint posterior distributions for each pair of parameters, and the histograms at the top of each column show the marginal posteriors of each parameter. Black points show individual samples from the MCMC chains.
Other Images in This Article


Copyright and Terms & Conditions
© 2025. The Author(s). Published by the American Astronomical Society.
Copyright ©
2025 Astronomy Image Explorer. All Rights Reserved.