Image Details
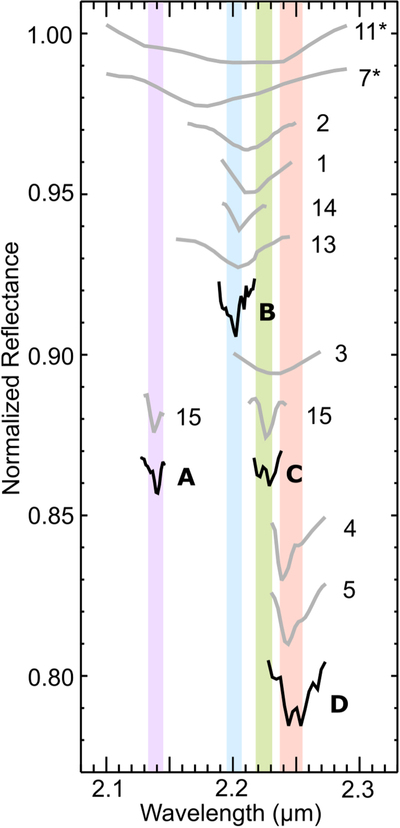
Caption: Figure 5.
Comparison between continuum-divided absorption features in the four grand average spectra (black, A–D) and representative laboratory and synthetic spectra (gray). The number to the right of each spectrum corresponds to the same number shown in Figure 4 and Tables 3 and 4. All continuum-divided bands are offset vertically for clarity. The wavelength range in band centers displayed by the 2.14 μm, 2.2 μm, 2.22 μm, and 2.24 μm bands (Tables A2–A5) are highlighted by the purple, blue, green, and red zones, respectively. The laboratory and synthetic spectra shown here represent the best matches to these four bands, based on comparison of their band centers: (A) 2.14 μm band compared to methylamine (15); (B) 2.2 μm band compared to NH4 chloride (11*), NH4 carbonate (7*), flash-frozen NH3–H2O solution (2), mixed NH3-hydrates (1), kaolinite (14), and thermonatrite (13); (C) 2.22 μm band compared to amorphous NH3 (3) and methylamine (15); and (D) 2.24 μm band compared to NH3 ice (4 and 5). Continuum-divided bands 7* and 11* only represent the central portion of the broad absorption features present in these spectra (Figure 4).
Other Images in This Article


Copyright and Terms & Conditions
© 2023. The Author(s). Published by the American Astronomical Society.