

Image Details
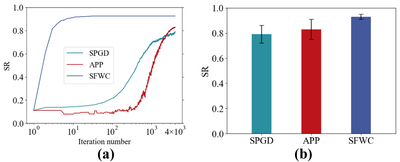
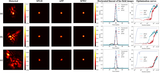
Caption: Figure 6.
(a) Average optimization curves of the three algorithms on D/r0 = 6 ∼ 15 testing sets. (b) Comparison of correction results of the three algorithms on D/r0 = 6 ∼ 15 testing sets.
Other Images in This Article
Show More
Copyright and Terms & Conditions
© 2026. The Author(s). Published by the American Astronomical Society.

Copyright ©
2026 Astronomy Image Explorer. All Rights Reserved.
