

Image Details
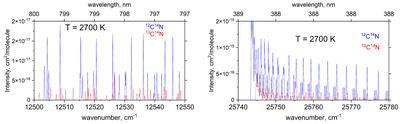
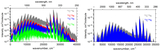
Caption: Figure 11.
Absorption spectra of 12C14N and 13C14N at T = 2700 K assuming the isotopic ratio 12C/13C = 7 (C. Sneden et al. 2014) for two small windows in the A and B bands illustrating the relative contribution of 13C14N. Here, a Gaussian line profile with an HWHM of 0.073 cm−1 was used to mimic the observational conditions of WZ Cas, WX Cyg, and TX Psc (R. P. Hedrosa et al. 2013).
Other Images in This Article
Copyright and Terms & Conditions
© 2026. The Author(s). Published by the American Astronomical Society.

Copyright ©
2026 Astronomy Image Explorer. All Rights Reserved.
