

Image Details
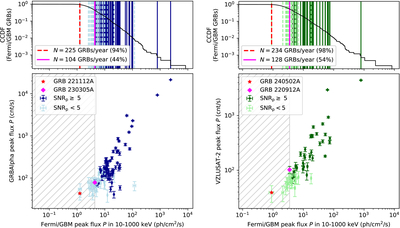
Caption: Figure 11.
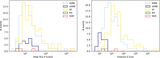
Comparison of the peak flux P of GRBs observed by GRBAlpha (left) and VZLUSAT-2 (right) with Fermi/GBM. Top: complementary cumulative distribution function of all GBM GRBs detected until 2025 November 18. The black curve marks the normalized number of GBM GRBs with P higher than or equal to the given value. The solid (dashed) vertical lines represent significant (subthreshold) detections by GRBAlpha or VZLUSAT-2. The dashed red line marks the faintest GRB from the full sample of GRBAlpha or VZLUSAT-2 GRBs. The solid magenta line is the faintest GRB out of the ones observed at a level higher than 5σ. The average number of GRBs N detected per year by GBM with P higher than or equal to the faintest subthreshold and significant detection by each CubeSat is stated in the legend along with the percentage of GBM GRBs this value corresponds to. Bottom: comparison of the peak flux measured by GRBAlpha (left) and VZLUSAT-2 (right) with Fermi/GBM. The red star highlights the faintest GRB from the full sample. The magenta diamond highlights the faintest GRB from the sample of significant GRBs (SNR ≥ 5σ). The gray hatched part to the left marks a region where observed GRBs are fainter than the faintest significant GRB.
Other Images in This Article
Show More
Copyright and Terms & Conditions
© 2026. The Author(s). Published by the American Astronomical Society.

