

Image Details
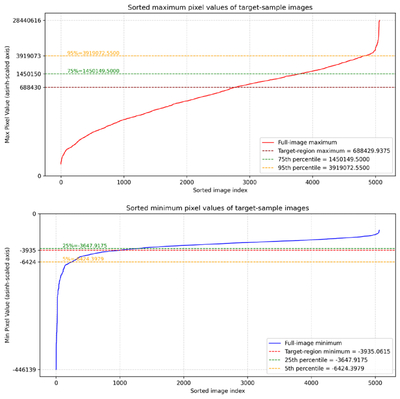
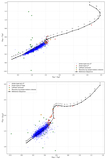
Caption: Figure 3.
Distribution of minimum and maximum pixel values in images containing target sources. For each image, the full-image maximum and minimum values are calculated and sorted by value. The corresponding maximum and minimum values within the target regions are also marked. The vertical axes use inverse-hyperbolic-sine scaling to compress extreme outliers while preserving the sign of the pixel values; different scale parameters are used for the maximum- and minimum-value panels because their dynamic ranges differ.
Other Images in This Article
Copyright and Terms & Conditions
© 2026. The Author(s). Published by the American Astronomical Society.

Copyright ©
2026 Astronomy Image Explorer. All Rights Reserved.
