

Image Details
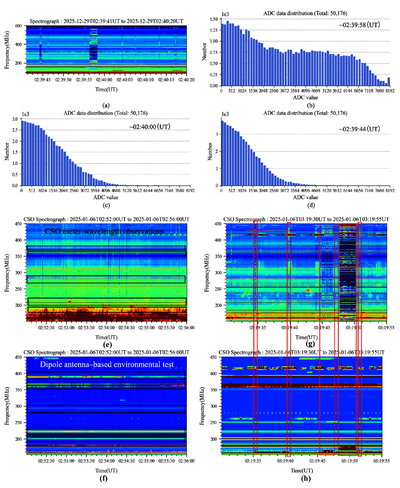
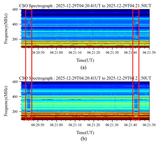
Caption: Figure 7.
Spectrogram and time-domain statistical analysis plots of the CSO Meter-wave Solar Radio Observatory System and the surrounding environmental interference. Panel (a) shows the dynamic spectrum, and panels (b)–(d) show the ADC time-domain sampling results. Panels (e) and (g) show the data obtained by the CSO Meter-wave Solar Radio Observatory System, while panels (f) and (h) show the corresponding environmental noise detected by the test antenna.
Other Images in This Article
Copyright and Terms & Conditions
© 2026. The Author(s). Published by the American Astronomical Society.

Copyright ©
2026 Astronomy Image Explorer. All Rights Reserved.
