

Image Details
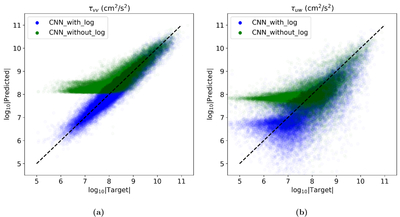
Caption: Figure 18.
The scatter plots of two components τvv in panel (a) and τuw in panel (b), comparing the predictions of the 3DCNN1 trained with data before and after normalization. Blue dots represent the predictions of CNN when trained with normalized data, and green represents the predictions of CNN when trained without a log transform.
Other Images in This Article
Show More
Copyright and Terms & Conditions
© 2026. The Author(s). Published by the American Astronomical Society.

Copyright ©
2026 Astronomy Image Explorer. All Rights Reserved.
