Image Details
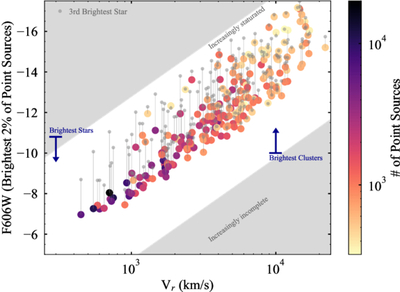
Caption: Figure 7.
The absolute F606W magnitude of the brightest 2% of reliably measured stellar sources in each image, as a function of the recessional velocity of the system. Points are color coded by the total number of well-measured stellar sources in each system (Table D1), uncorrected for the estimated population of foreground Milky Way field stars. The colored points are connected by thin lines to gray dots, which indicate the magnitude of the third brightest star in the same system, which is a noisier but potentially more accurate indicator of the maximum luminosity of stars or clusters in the system. Generally, there are fewer detected stellar sources in more distant targets, due to the worse resolution at larger distances. The upper and lower limits in blue indicate the typical maximum absolute magnitude of massive stars (at 0.1 Z⊙, dropping up to 2 mag fainter for solar metallicities), and the brightest stellar clusters as determined empirically by N. Bastian (2008), who found that the brightest cluster magnitude was strongly correlated with the overall SFR. Systems with recessional velocities beyond 2000–3000 km s−1 are likely to have stellar clusters or blends at their brightest sources, but individual luminous stars can potentially be detected if they are sufficiently isolated. Sources plotted in this figure are restricted to be in regions with the highest 50% of local density among all sources, to minimize contamination from foreground stars.
Other Images in This Article
Show More
Copyright and Terms & Conditions
© 2026. The Author(s). Published by the American Astronomical Society.