Image Details
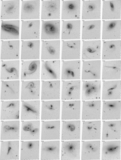
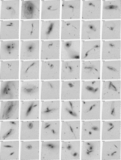
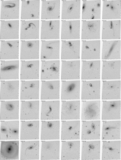
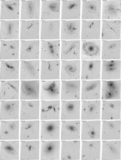
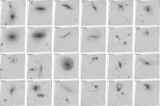
Caption: Figure B1. Atlas Images
The complete figure set (216 images) is available in the online journal.
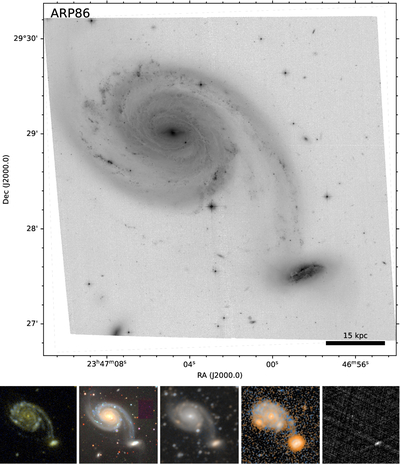
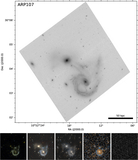
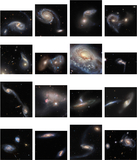
Example of multiwavelength imaging for Arp 86; the full set of 216 plots for the catalog is available online. The large upper panel shows the full-resolution version of Arp 86, as viewed with HST/ACS and plotted in sky coordinates (top: F606W). The scale bar (in kiloparsecs) is calculated from the recessional velocity listed in Table 1, assuming a pure Hubble flow with H0 = 70 km s−1 Mpc−1; this scale will not necessarily be accurate for nearer galaxies where peculiar velocities are significant, or for foreground or background interloping galaxies. The bottom row shows a panchromatic view of the galaxy, from short to long wavelengths. From left to right, the panels show GALEX (NUV+FUV); the Legacy Survey imaging (optical); NEOWISE (W1+W2 and W3+W4); and VLASS (1.4 GHz continuum), all matched to the FOV of the upper plot.
Other Images in This Article
Show More
Copyright and Terms & Conditions
© 2026. The Author(s). Published by the American Astronomical Society.