Image Details
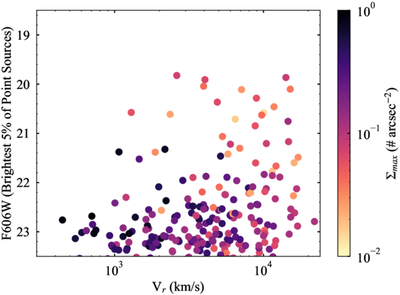
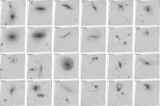
Caption: Figure 10.
The apparent F606W magnitude of the brightest 5% of reliably measured stellar sources in each image, as a function of the recessional velocity of the system. Points are color coded by the maximum local stellar density of each system (Table D1). Images with low maximum densities are likely to consist of angularly small and/or poorly resolved targets, leading their brightest stellar sources to be either stellar clusters or foreground stars.
Other Images in This Article
Show More
Copyright and Terms & Conditions
© 2026. The Author(s). Published by the American Astronomical Society.
Copyright ©
2026 Astronomy Image Explorer. All Rights Reserved.