

Image Details
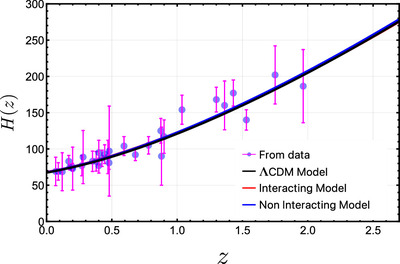
Caption: Figure 4.
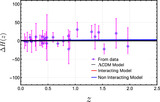
The evolution of the Hubble parameter as a function of redshift is presented for the ΛCDM model (black line), the interacting model (red line), and the noninteracting model (blue line). These are compared against the observational Hubble measurements, represented by purple dots with corresponding error bars shown as magenta lines.
Other Images in This Article
Copyright and Terms & Conditions
© 2025. The Author(s). Published by the American Astronomical Society.

Copyright ©
2026 Astronomy Image Explorer. All Rights Reserved.
