Image Details
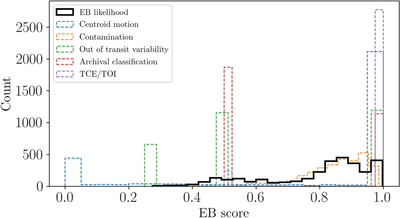
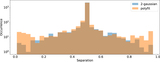
Caption: Figure 7.
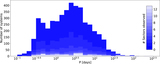
Histogram showing the distribution of the individual test scores (dashed outlines), which combined, give the overall likelihood of the candidate being a real EB (solid black outlines).
Other Images in This Article

Show More
Copyright and Terms & Conditions
© 2022. The Author(s). Published by the American Astronomical Society.
Copyright ©
2026 Astronomy Image Explorer. All Rights Reserved.