Image Details
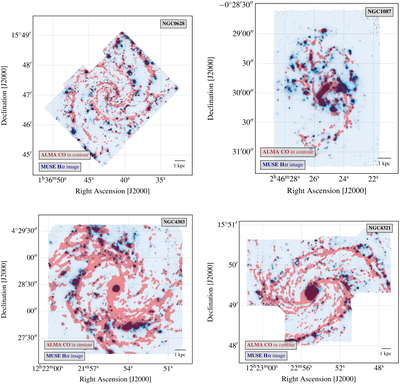
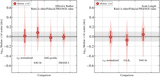
Caption: Figure 3.
At high spatial resolution, tracers of massive young stars, here Hα, and cold, molecular gas here traced by CO, visibly separate, providing statistical constraints on timescales for star formation and feedback. Each figure shows the CO(2−1) peak intensity maps from PHANGS–ALMA in a red contour plotted over Hα emission measured from VLT-MUSE integral field unit observations in blue (PHANGS–MUSE, Emsellem et al. 2021; see also Kreckel et al. 2016, 2018). The CO(2−1) traces cold, often star-forming gas. The Hα traces ionizing photons produced by young stars. Though the two track one another on large scales, they show distinct distributions on small scales, reflecting that they trace different phases of the star formation process (e.g., Kawamura et al. 2009; Schruba et al. 2010; Kruijssen & Longmore 2014). The joint distributions of these two tracers, as well as stellar clusters identified by HST, constrain the timescales associated with different phases of the star formation process. In turn, these inferred timescales offer observational constraints on topics from stellar feedback to the interplay of gravity and turbulence (e.g., Chevance et al. 2020c).
Other Images in This Article
Show More
Copyright and Terms & Conditions
© 2021. The American Astronomical Society. All rights reserved.