Image Details
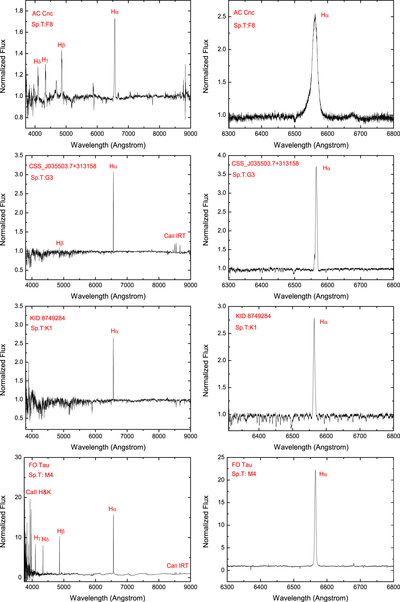
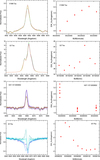
Caption: Figure 7.
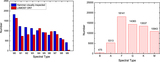
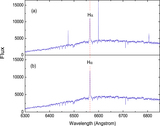
Normalized spectra of different spectral types with Hα emission line in both LAMOST LR (left panel) and MR (right panel) surveys. The emission lines indicating chromospheric activity are marked in red for each normalized spectrum.
Other Images in This Article
Show More
Copyright and Terms & Conditions
© 2021. The American Astronomical Society. All rights reserved.
Copyright ©
2026 Astronomy Image Explorer. All Rights Reserved.