Image Details
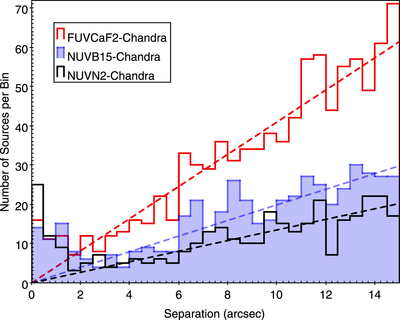
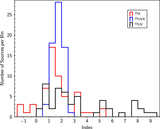
Caption: Figure 2.
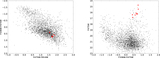
Distribution of separations between UVIT sources and Chandra sources. Linear fits (dashed lines) to the distributions for separations >3.″0 are plotted as dashed lines and extrapolated to smaller separations.
Other Images in This Article
Copyright and Terms & Conditions
© 2020. The American Astronomical Society. All rights reserved.
Copyright ©
2026 Astronomy Image Explorer. All Rights Reserved.