Image Details
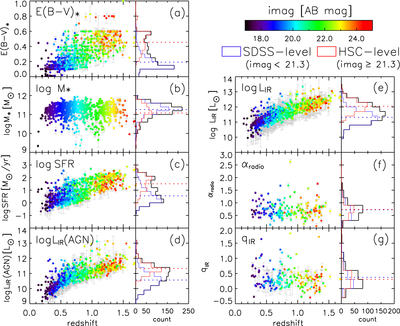
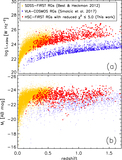
Caption: Figure 8.
(a) The color excess (E(B − V)*), (b) stellar mass, (c) SFR, (d) IR luminosity contributed from AGNs, (e) total IR luminosity, (f) radio spectral index (αradio), and (g) qIR of HSC–FIRST RGs as a function of redshift. The color code is i-band magnitude. The histograms show the SDSS-level (blue), HSC-level (red), and total (black) objects. The dashed lines are mean values of each quantity for SDSS-level (blue) and HSC-level (red) objects. 835 RGs are plotted in panels (a) to (e) while 190 RGs with FIRST and TGSS data are plotted in panels (f) and (g).
Other Images in This Article

Show More
Copyright and Terms & Conditions
© 2019. The American Astronomical Society. All rights reserved.
Copyright ©
2026 Astronomy Image Explorer. All Rights Reserved.