Image Details
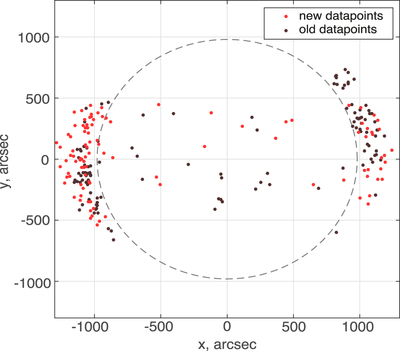
Caption: Figure 2.
Locations of the centers of each slit used in the analysis of kink oscillations on the solar disk. The dark brown dots correspond to the data from Goddard et al. (2016), and the red dots correspond to the new data.
Other Images in This Article
Copyright and Terms & Conditions
© 2019. The American Astronomical Society. All rights reserved.
Copyright ©
2026 Astronomy Image Explorer. All Rights Reserved.