Image Details
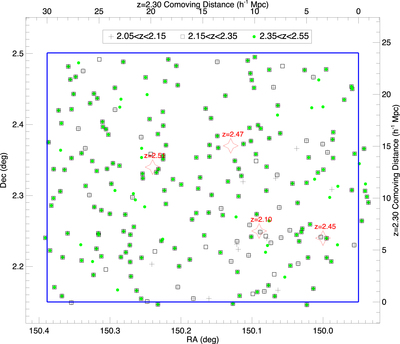
Caption: Figure 6.
Angular position of the Lyα forest sightlines used to tomographically reconstruct the Lyα forest at ﹩2.05\lt z\lt 2.55﹩. The different symbols denote coverage over different redshift ranges. Some background sources have the correct redshift to cover large ranges of our targeted foreground redshift range and are therefore indicated by multiple symbols. We have also marked with red diamonds the angular position of several known overdensities, at z = 2.10 (Spitler et al. 2012; Nanayakkara et al. 2016), z = 2.44 (Chiang et al. 2015; Diener et al. 2015), z = 2.47 (Casey et al. 2015), and z = 2.51 (Wang et al. 2016). The top and right axes denote the transverse comoving distances in the coordinates of our tomographic map grid.
Other Images in This Article
Show More
Copyright and Terms & Conditions
© 2018. The American Astronomical Society. All rights reserved.