Image Details
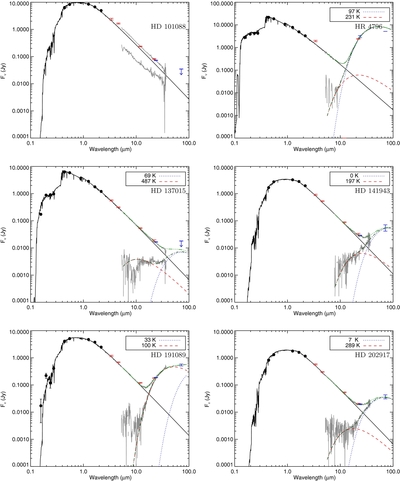
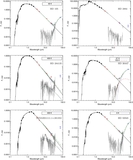
Caption: Figure 4. The Spectral Energy Distributions (SEDs)
The complete figure set (571 images) is available in the online journal.
Spectral energy distributions (SEDs) for a representative set of targets in our sample. TD1, Hipparcos BV, and 2MASS JHKs photometry are plotted as black circles. WISE and Spitzer MIPS photometry are shown using red and blue error bars, and the IRS spectrum and photosphere-subtracted spectrum are shown in gray. Overlaid is the best-fit Kurucz stellar atmosphere model (black line). For stars with excesses, the best model, either one or two blackbodies, is plotted in green. SEDs that are better fit using a single-temperature blackbody model have the blackbody overlaid using a blue dotted line. SEDs that are better fit using a two-temperature blackbody model have each component shown separately using blue dotted and a red dashed lines. SEDs for all targets are available in the online journal.
Other Images in This Article
Show More
Copyright and Terms & Conditions
© 2014. The American Astronomical Society. All rights reserved.