Image Details
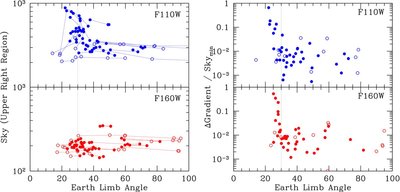
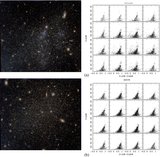
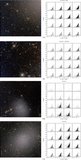
Caption: Figure 5.
Left: sky level (counts per pixel) in the upper right quadrant of all F110 W and F160 W exposures (top and bottom, respectively), as a function of the average angle between the spacecraft's V1 axis and the Earth's limb during the exposure; open circles indicate that the limb was dark at the time of observation. Successive exposures in a single orbit are connected by lines, but intermediate non-destructive reads are not shown. In F110 W, the mean sky level is clearly correlated with proximity to the Earth's limb, when the limb is bright. Right: the amplitude of the scattered light feature seen in Figure 4 (as a fraction of the sky brightness), as a function of the average angle to the Earth's limb during each observation. The amplitude of the scattered light feature is taken to be the excess counts in the affected region, compared to the variation in the mean sky level seen in the unaffected upper right quadrant. It is calculated by first calculating a gradient across the image using the difference between the amplitude of the sky in the affected region and the unaffected region in the upper right of the image. The smallest gradient for the exposures in a given orbit is then taken to be the expected true spatial variation in the sky background, in the absence of scattered light. The amplitude of the scattered light feature is then scaled to the level of the sky in the upper right quadrant of each image, giving the approximate amplitude of the feature as a percent of sky. The scattered light feature turns on abruptly at Earth limb angles less than 30°.
Other Images in This Article

Show More
Copyright and Terms & Conditions
© 2012. The American Astronomical Society. All rights reserved.