

Image Details
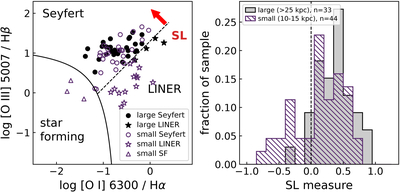
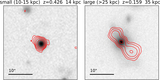
Caption: Figure 1.
Left: the two samples on the [O I]/Hα versus [O III]/Hβ diagram, with the classification boundaries of L. J. Kewley et al. (2006). The large sample (> 25 kpc) is almost entirely Seyfert, while the small sample (10–15 kpc) is a mix of Seyferts and LINERs. The arrow shows how the perpendicular distance from the Seyfert–LINER dividing line—the SL (Seyfert–LINER) measure—is defined. Right: histogram of the SL measure, with positive distances on the Seyfert side. The small sources sit systematically closer to the LINER boundary.
Other Images in This Article
Copyright and Terms & Conditions
© 2026. The Author(s). Published by the American Astronomical Society.

Copyright ©
2026 Astronomy Image Explorer. All Rights Reserved.
