

Image Details
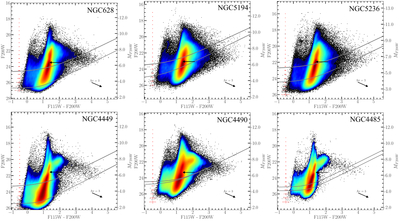
Caption: Figure 1.
Hess diagram of F115W−F200W versus F200W CMD containing stars over the entire JWST-FEAST NIRCam FoV. Black points indicate points above 90th percentile of kernel density. Top: (left to right) NGC 628, NGC 5194, and NGC 5236. Bottom: (left to right) NGC 4449, NGC 4490, and NGC 4485. The typical errors on magnitude and color are given as a vertical sequence of red error bars in the left part of the diagrams. The 50% completeness limit is shown by the gray curves, with the upper and lower curves corresponding to the inner and outer parts of the galaxies, respectively. The reddening vector corresponding to AV = 3 mag is shown at the bottom-right corner of each panel. A horizontal arrow is placed at the absolute magnitude MF200W = −6.354 mag (right axis) corresponding to fixed age (﹩\mathrm{log}﹩(Age/yr) = 10) and metallicity (Z = 0.002 or equivalently ﹩\mathrm{log}(Z/Z\odot )=-0.93﹩), and using the distance modulus from column (7) in Table 1. A slight shift between the TRGB point for each galaxy and arrow location can be visualized, which is due to the changes in the metallicity.
Other Images in This Article
Copyright and Terms & Conditions
© 2026. The Author(s). Published by the American Astronomical Society.

