

Image Details
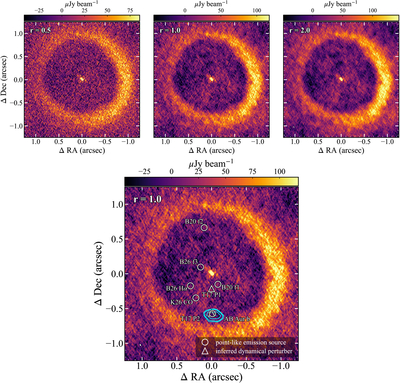
Caption: Figure 1.
ALMA 0.88 mm continuum images of the AB Aur disk produced with Briggs robust values (r) of 0.5, 1.0, and 2.0 (top row). The bottom panel shows the r = 1.0 image, with cyan contours tracing the HST/WFC3 Hα detection of AB Aur b at 8, 10, 15, 20, and 25× the image rms from B. P. Bowler et al. (2025). Open symbols mark planet candidates within the field (Section 2): circles denote pointlike emission sources and triangles denote dynamically inferred perturbers, following J. Speedie et al. (2024). The dust ring peaks at ﹩\sim 0\mathop{.}\limits^{^{\prime\prime} }9﹩ (∼140 au), and compact emission is detected at the stellar position; however, no significant point-source emission is detected at AB Aur b or the other candidate locations. The synthesized beam is shown in the lower-left corner of each panel.
Other Images in This Article
Copyright and Terms & Conditions
© 2026. The Author(s). Published by the American Astronomical Society.

