

Image Details
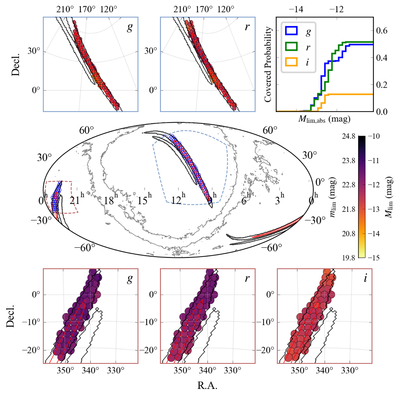
Caption: Figure 1.
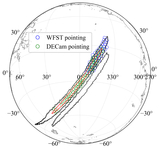
Skymap coverage and multiband depths of WFST on the first night for S251112cm. Middle: the overall coverage by WFST, overlaid with the Bilby skymap of S251112cm from Ligo Scientific Collaboration et al. (2025c), showing the 50% (red) and 90% (black) probability contours. Galactic extinction is also indicated, with the contour of E(B − V) = 0.3 shown for reference (E. F. Schlafly & D. P. Finkbeiner 2011). A WFST pointing is represented by a circle with a radius of 1.∘4. Top: zoomed-in view of the covered regions in the g and r bands over the R.A. range from 9h to 13h, corresponding to the region outlined by the blue dashed line in the middle panel. The color map represents the 5σ limiting magnitudes ﹩{m}_{{\rm{lim}}}﹩ and limiting absolute magnitudes ﹩{M}_{{\rm{lim}}}﹩, calculated assuming the mean GW luminosity distance of 93 Mpc. The top-right panel shows the cumulative GW localization probability covered by WFST as a function of limiting absolute magnitudes in the g, r, and i bands. Bottom: zoomed-in view of the covered regions in g, r, and i bands over the R.A. range from 22h to 24h, corresponding to the region outlined by the red dashed line.
Other Images in This Article
Copyright and Terms & Conditions
© 2026. The Author(s). Published by the American Astronomical Society.

