

Image Details
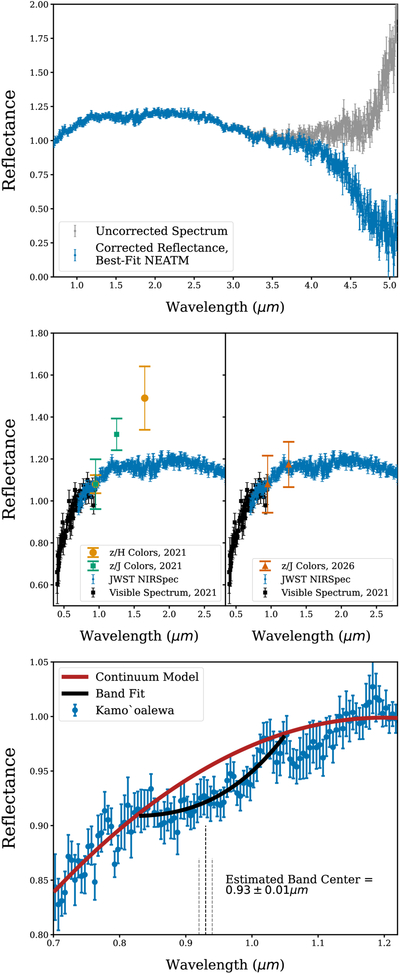
Caption: Figure 3.
Top: NIRSpec reflectance spectrum, including fluxes corrected for thermal emission (blue) and the original uncorrected spectrum (gray). The thermal correction was taken by subtracting the best-fit NEATM model from the grand-averaged SED. The overall spectrum is mildly red from 0.7 to 2.5 μm, and is blue at wavelengths greater than 2.5 μm. Middle: comparison of JWST and LBT near-infrared measurements. The 2021 observations have higher reflectance values at J and H than the JWST spectrum, demonstrating a clear discrepancy between JWST and previous ground-based infrared colors. Follow-up zJ measurements in 2026, conducted with the same experimental setup as in 2021, find good agreement with JWST but with limited SNR due to observing conditions. Bottom: we identify an absorption feature near 0.9 μm, which we associate with pyroxenes. The continuum model is displayed as a red polynomial fit to the spectrum outside of the band. The band fit is plotted in black, with a resulting band center of 0.93 ± 0.01 μm. The non-NEATM-subtracted averaged reflectance spectrum is available in machine-readable format as the data behind the figure.
(The data used to create this figure are available in the online article.)
(The data used to create this figure are available.)
Other Images in This Article
Copyright and Terms & Conditions
© 2026. The Author(s). Published by the American Astronomical Society.

