

Image Details
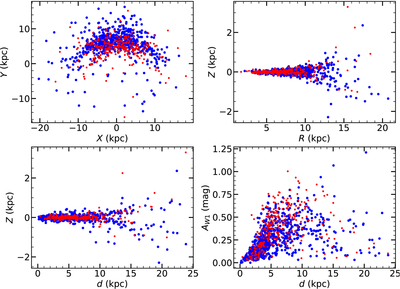
Caption: Figure 1.
Spatial and extinction distributions of the classical Cepheid sample. Red and blue points represent subsamples A and B, respectively. The top left panel shows the distribution in the Galactic (X−Y) plane. The top right and bottom left panels show the vertical height (Z) as a function of Galactocentric radius (R) and heliocentric distance (d), respectively. The bottom right panel shows the W1-band extinction, (AW1), as a function of d.
Other Images in This Article
Copyright and Terms & Conditions
© 2026. The Author(s). Published by the American Astronomical Society.

Copyright ©
2026 Astronomy Image Explorer. All Rights Reserved.
