

Image Details
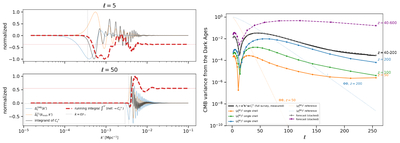
Caption: Figure 2.
Left panel: overlap of the CMB and 21 cm kernels that generate the cross-spectrum, shown for two multipoles as a function of the primordial wavenumber ﹩{k}^{{\prime} }﹩. The blue and orange curves are the CMB transfer function and the 21 cm transfer function. The black curve is the integrand of the cross-spectrum, and the red dashed curve is its running integral ﹩{\int }^{{k}^{{\prime} }}﹩, whose endpoint (thin horizontal line) is the full integral ﹩{C}_{\ell }^{\times }({k}_{{\rm{mid}}})﹩. The dotted vertical line marks ﹩{k}^{{\prime} }=\ell /{r}_{* }﹩, the spherical Bessel function turn-on. Right panel: colored curves show squared cross-correlations (21 cm and CMB) for shells at redshift z = 50, 100, and 200 (orange, green, and blue), while the black curve shows the coefficient Rℓ when conditioned on the full stack of shells, using the simulated maps. Purple dashed and gray dashed lines show the analytical coefficient Rℓ when the survey range is extended to z = 600 for the Planck primordial power spectrum and for our own survey using 21cmFAST. Dotted orange and blue lines show reference potential–potential squared correlations at z = 50 and 200, respectively.
Other Images in This Article
Copyright and Terms & Conditions
© 2026. The Author(s). Published by the American Astronomical Society.

