

Image Details
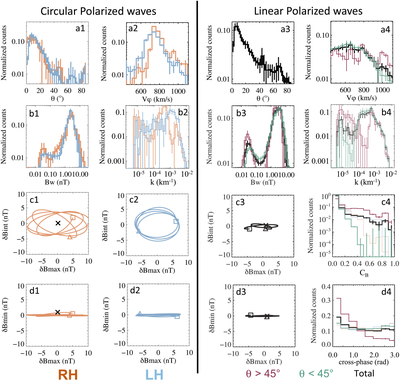
Caption: Figure 3.
Statistics of the four upstream wave families, integrated over 06:15–07:13 UT. Columns 1 and 2 show the circularly polarized families, RH (orange) and LH (blue), overlaid in the histogram rows (a, b) and separated in the hodogram rows (c, d), RH in column 1 and LH in column 2. Columns 3 and 4 show the linearly polarized class, split at θkB = 45∘ into LP-OB (maroon) and LP-FA (green), with the combined distribution in black (legend: LP (all)). Classes are defined by the ellipticity partition at ∣ϵ∣ = 0.2. (a1, a3) Propagation angle θkB (deg) for the circular families and for the linear population, respectively. (a2, a4) Spacecraft-frame phase velocity Vφ (km s−1) for the circular families and for the linear population, respectively. (b1, b3) Wave amplitude Bw (nT) for the circular families and for the linear population, respectively. (b2, b4) Wavenumber k (km−1) for the circular families and for the linear population, respectively. (c1–c3) Representative hodograms in the ﹩(\delta {B}_{{\rm{\max }}},\delta {B}_{{\rm{int}}})﹩ plane for RH, LH, and the combined linear population, respectively, with ﹩\delta {B}_{{\rm{\max }}}﹩, δBint, ﹩\delta {B}_{{\rm{\min }}}﹩ the maximum-, intermediate-, and minimum-variance components of the fluctuation, respectively. In each hodogram the cross marks the mean field and the square and triangle mark the two endpoints of the trace. (c4) Magnetic compressibility CB distribution for the two linear families, with the circular families overplotted. (d1–d3) Hodograms in the ﹩(\delta {B}_{{\rm{\max }}},\delta {B}_{{\rm{\min }}})﹩ plane for RH, LH, and the combined linear population, respectively. (d4) Density–field cross-phase Φ(δn, δ∣B∣) (rad) for the two linear families, with the circular families overplotted.
Other Images in This Article
Copyright and Terms & Conditions
© 2026. The Author(s). Published by the American Astronomical Society.

