

Image Details
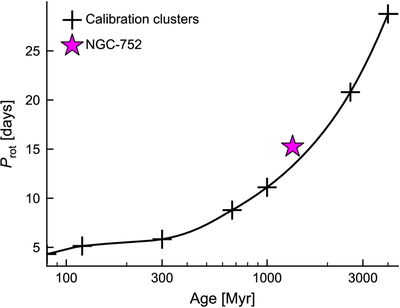
Caption: Figure 4.
Rotational evolution of a 5500 K star. Adapted from Figure 4 of L. G. Bouma et al. (2023). The black curve shows the rotation period evolution predicted by gyro-interp over the first ∼4 Gyr of a 5500 K star’s life. Black plus signs mark the rotation periods at 5500 K for the calibration clusters shown in Figure 2. The magenta star marks the representative location of NGC-752 at the adopted age of 1.3 Gyr. Its position above the model track indicates a longer rotation period than predicted, which could reflect an underestimated cluster age, rotational evolution not captured by the model, or both.
Other Images in This Article


Copyright and Terms & Conditions
© 2026. The Author(s). Published by the American Astronomical Society.

Copyright ©
2026 Astronomy Image Explorer. All Rights Reserved.
