

Image Details
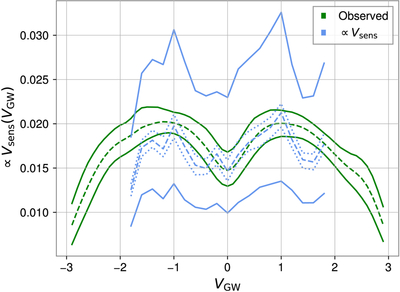
Caption: Figure C1.
Observed distribution vs. selection bias. The green curves denote the median and 90% credible bounds for the distribution of VGW on the analyzed O1–O4a events shown in Figure 5. The blue dashed line and solid contours denote the median estimate for the marginalized detection probability or sensitive volume Vsens(VGW), together with the 90% credible bounds. The dotted contour represents the 90% credible bounds on the median.
Other Images in This Article
Show More
Copyright and Terms & Conditions
© 2026. The Author(s). Published by the American Astronomical Society.

Copyright ©
2026 Astronomy Image Explorer. All Rights Reserved.
