

Image Details
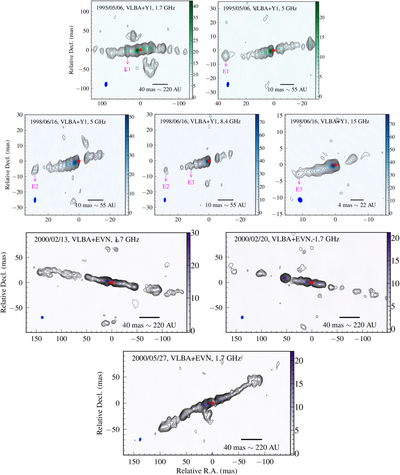
Caption: Figure 1.
VLBI images of SS 433 obtained from different projects (see Table 1). The color bar indicates the intensity in mJy beam−1, and the contour levels are ﹩\pm 3{I}_{{\rm{rms}}}\times {\sqrt{2}}^{\,n}﹩, with n = 1, 2, 3, …. The synthesized beam is shown by the blue ellipse in the bottom-left corner of each panel. The optically thin E1, E2, and E3 components are used to determine the core shifts for different frequency pairs (see Section 3.1). The putative location of the central binary system has been shifted to the image center based on the measured core shifts (see Table 2) and is marked by a red star. A gap is apparent in these images, which is attributed to free–free absorption affecting the western jet emission (Z. Paragi et al. 1999).
Other Images in This Article
Copyright and Terms & Conditions
© 2026. The Author(s). Published by the American Astronomical Society.

