

Image Details
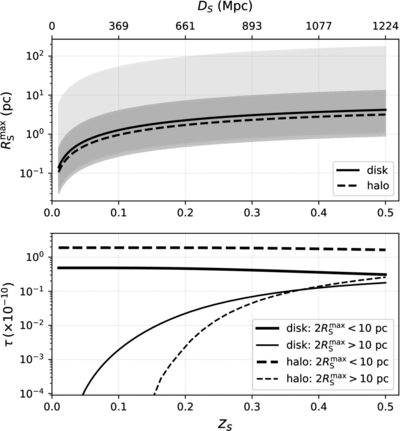
Caption: Figure 3.
Top panel: physical size upper limit ﹩{R}_{S}^{{\rm{\max }}}﹩ of background H II regions as a function of source redshift zS (or DS). The solid and dashed black curves denote the mean ﹩{R}_{S}^{{\rm{\max }}}﹩ for BHs in the Galactic disk and halo, respectively. The light and dark shaded regions enclose the full range (from minimum to maximum) of ﹩{R}_{S}^{{\rm{\max }}}﹩ for each component. Bottom panel: optical depth τ contributed by disk (solid lines) and halo (dashed lines) BHs. Thick lines are for compact H II regions, while thin lines are for extended ones.
Other Images in This Article
Copyright and Terms & Conditions
© 2026. The Author(s). Published by the American Astronomical Society.

Copyright ©
2026 Astronomy Image Explorer. All Rights Reserved.
