

Image Details
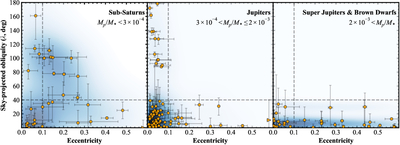
Caption: Figure 2.
Sky-projected obliquity as a function of orbital eccentricity, shown separately for sub-Saturns (left), Jupiters (center), and more super Jupiters and brown dwarfs (right). Orange circles indicate individual systems, while the blue shading represents the underlying density distribution. The vertical dashed lines mark e = 0.1, and the horizontal dashed lines represent λ = 40°. Systems with eccentricities >0.6 are shown at the right boundary with right-pointing triangles.
Other Images in This Article
Copyright and Terms & Conditions
© 2026. The Author(s). Published by the American Astronomical Society.

Copyright ©
2026 Astronomy Image Explorer. All Rights Reserved.
