

Image Details
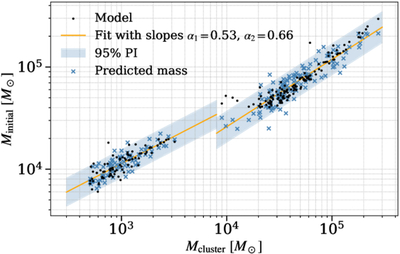
Caption: Figure 6.
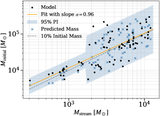
Log-log fit to the simulated initial cluster mass and the present-day cluster mass using weighted OLS regression in two mass bins (boundary at Mcluster = 8000 M⊙). Similar to Figure 5, only systems with L > 1000 kpc km s−1 are included for the fits. The lower-mass fit has a slope α1 = 0.53, and the higher-mass fit has a slope α2 = 0.66. The blue band shows the 95% prediction interval, and the crosses show the possible predicted initial cluster mass based on the fit and the 95% interval.
Other Images in This Article
Copyright and Terms & Conditions
© 2026. The Author(s). Published by the American Astronomical Society.

Copyright ©
2026 Astronomy Image Explorer. All Rights Reserved.
